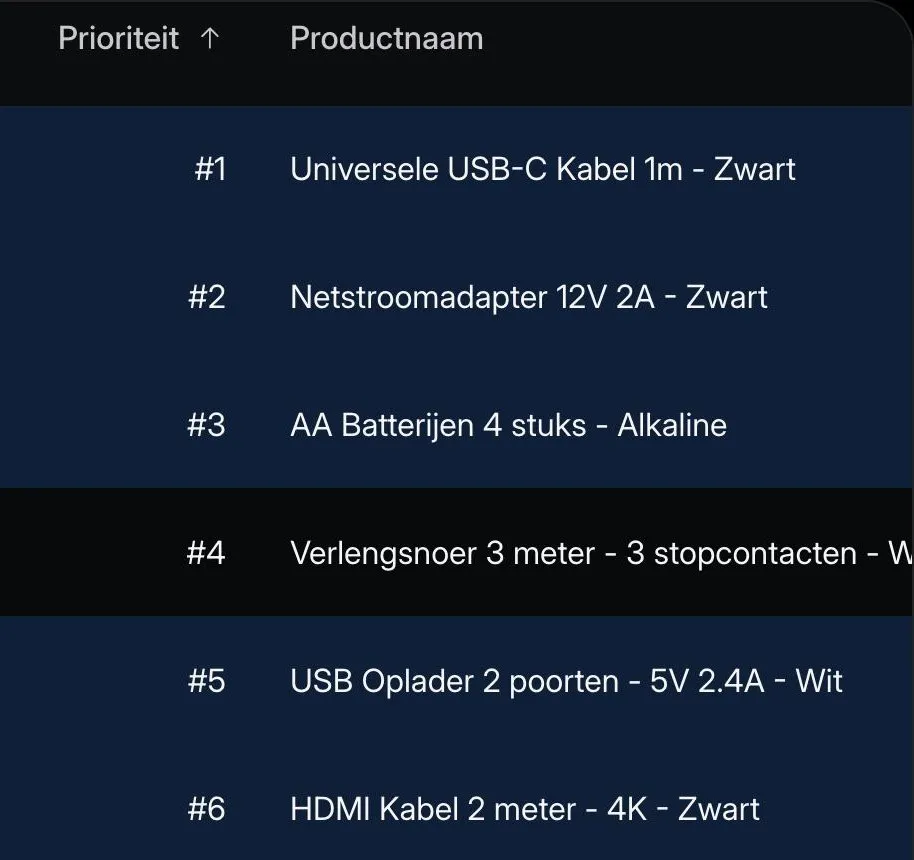
01Priority
A priority list, not a spreadsheet.
Every product gets a reorder advice and a rank. The team starts at the top and works down, instead of scanning thousands of rows.
Case study, Orbit Electronic
An internal platform I designed and built on my own to run purchasing, inventory and operations at Orbit Electronic.
13,000+active products, managed in it every day by colleagues from purchasing to customer service.
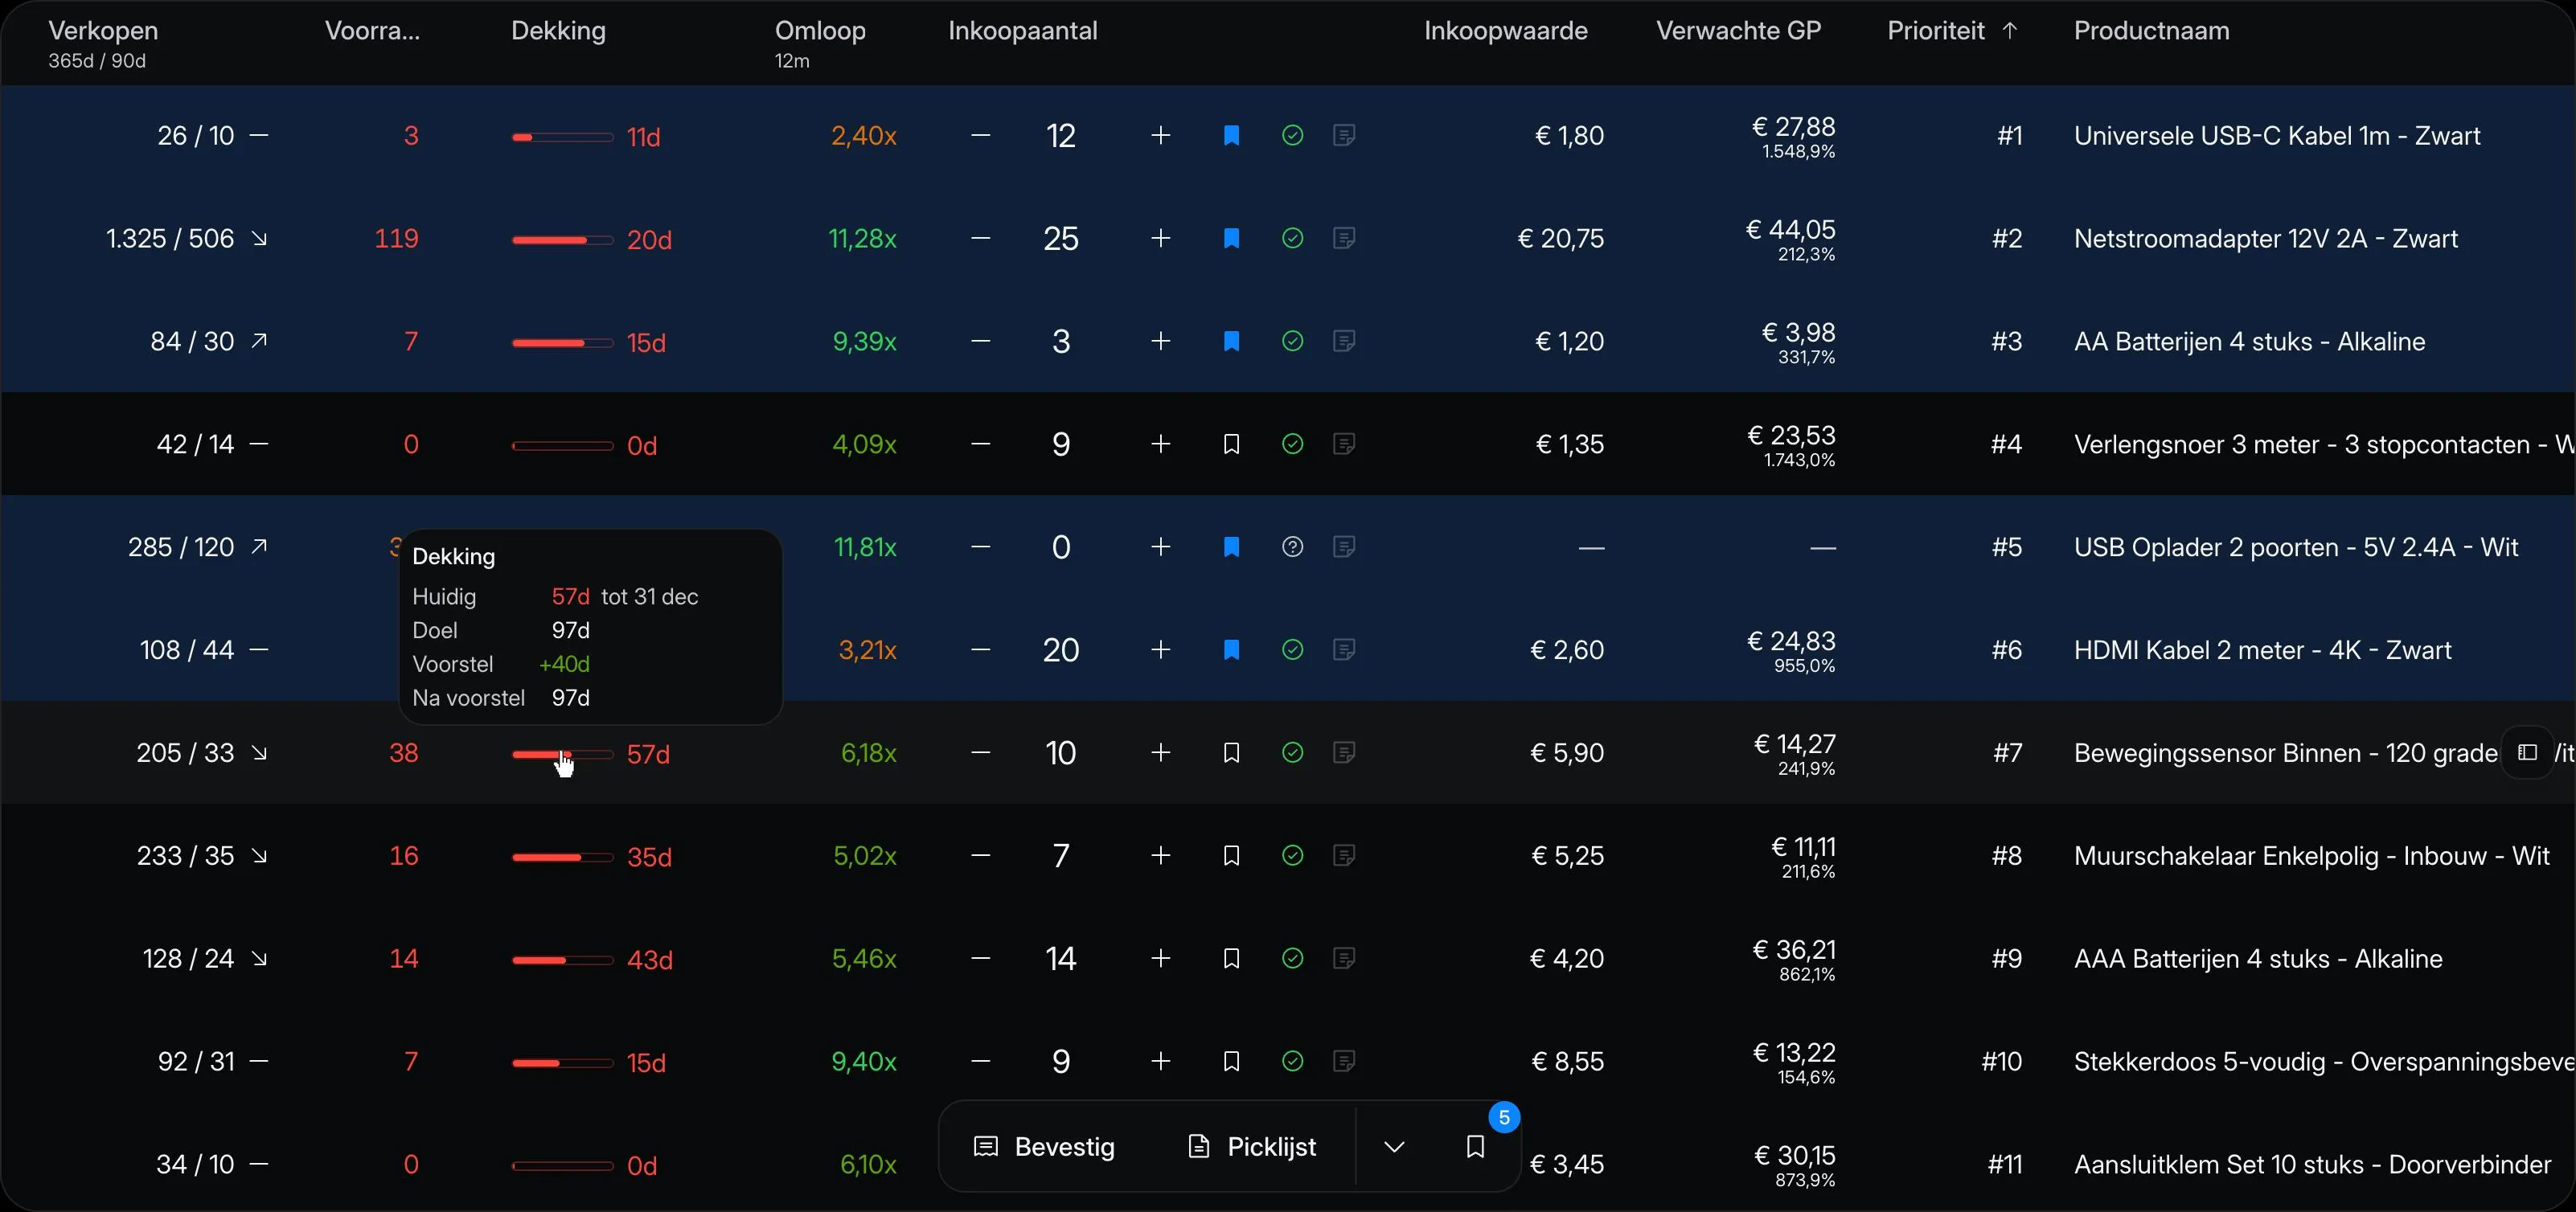
The purchasing view. Reorder advice per product, sorted by priority.
The problem
How it works
The purchasing view is where most of the work happens. Four details that show how I think about it. The interface is in Dutch, because that is what the team speaks.
01Priority
Every product gets a reorder advice and a rank. The team starts at the top and works down, instead of scanning thousands of rows.
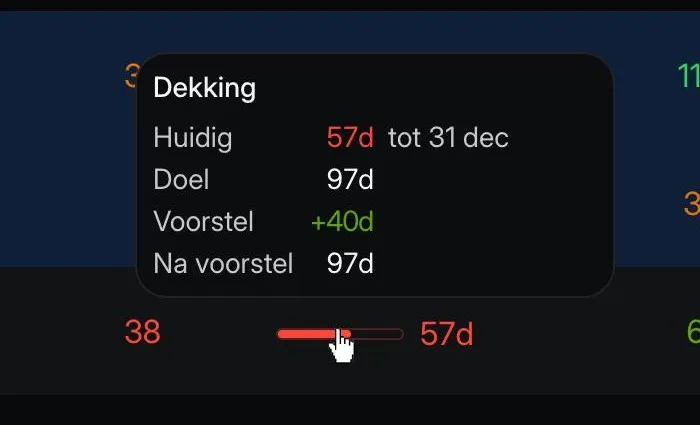
02Coverage
Coverage shows how many days of stock are left. Hover it and you see the math, what we have, what we aim for and what the advice adds. People only follow advice they can check, so I made it checkable.
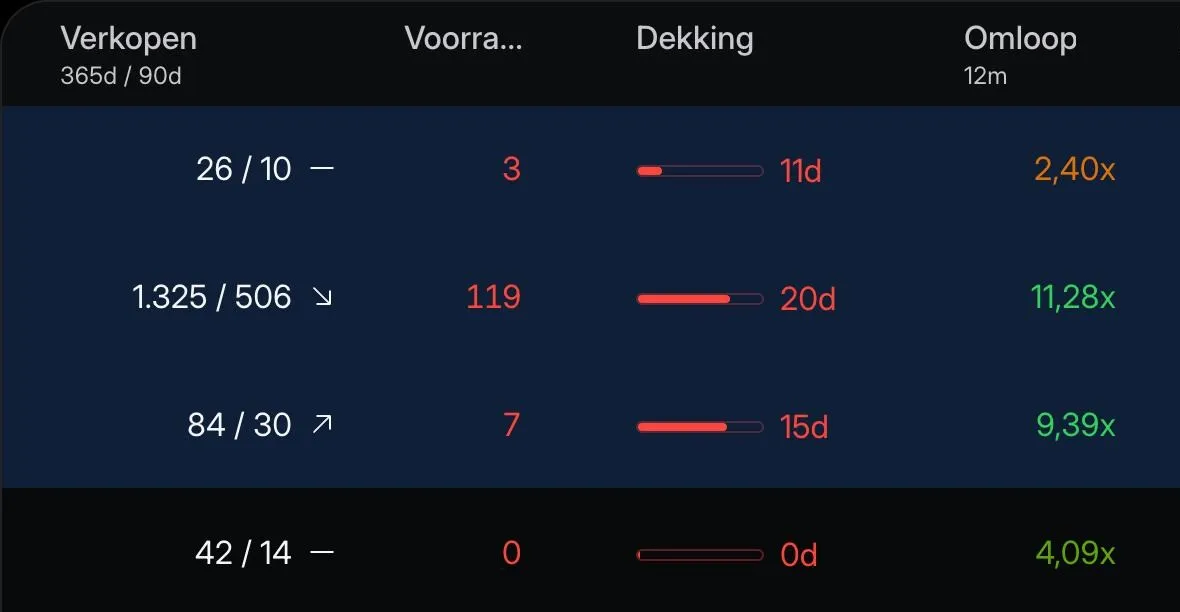
03Context
Sales over the last year and the last 90 days sit next to a trend icon, with turnover in colour. The advice is a starting point, and this is how a buyer sees when they know better.
04Confirm
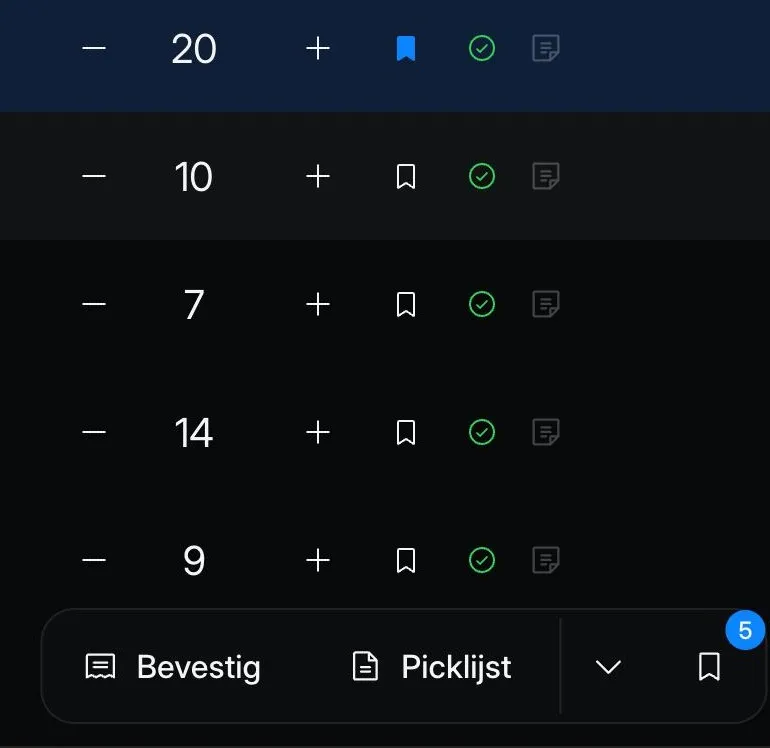
Change quantities with plus and minus, bookmark what matters, confirm once. The order syncs to the warehouse system, and a browser extension I built fills the carts on 14 supplier webshops.
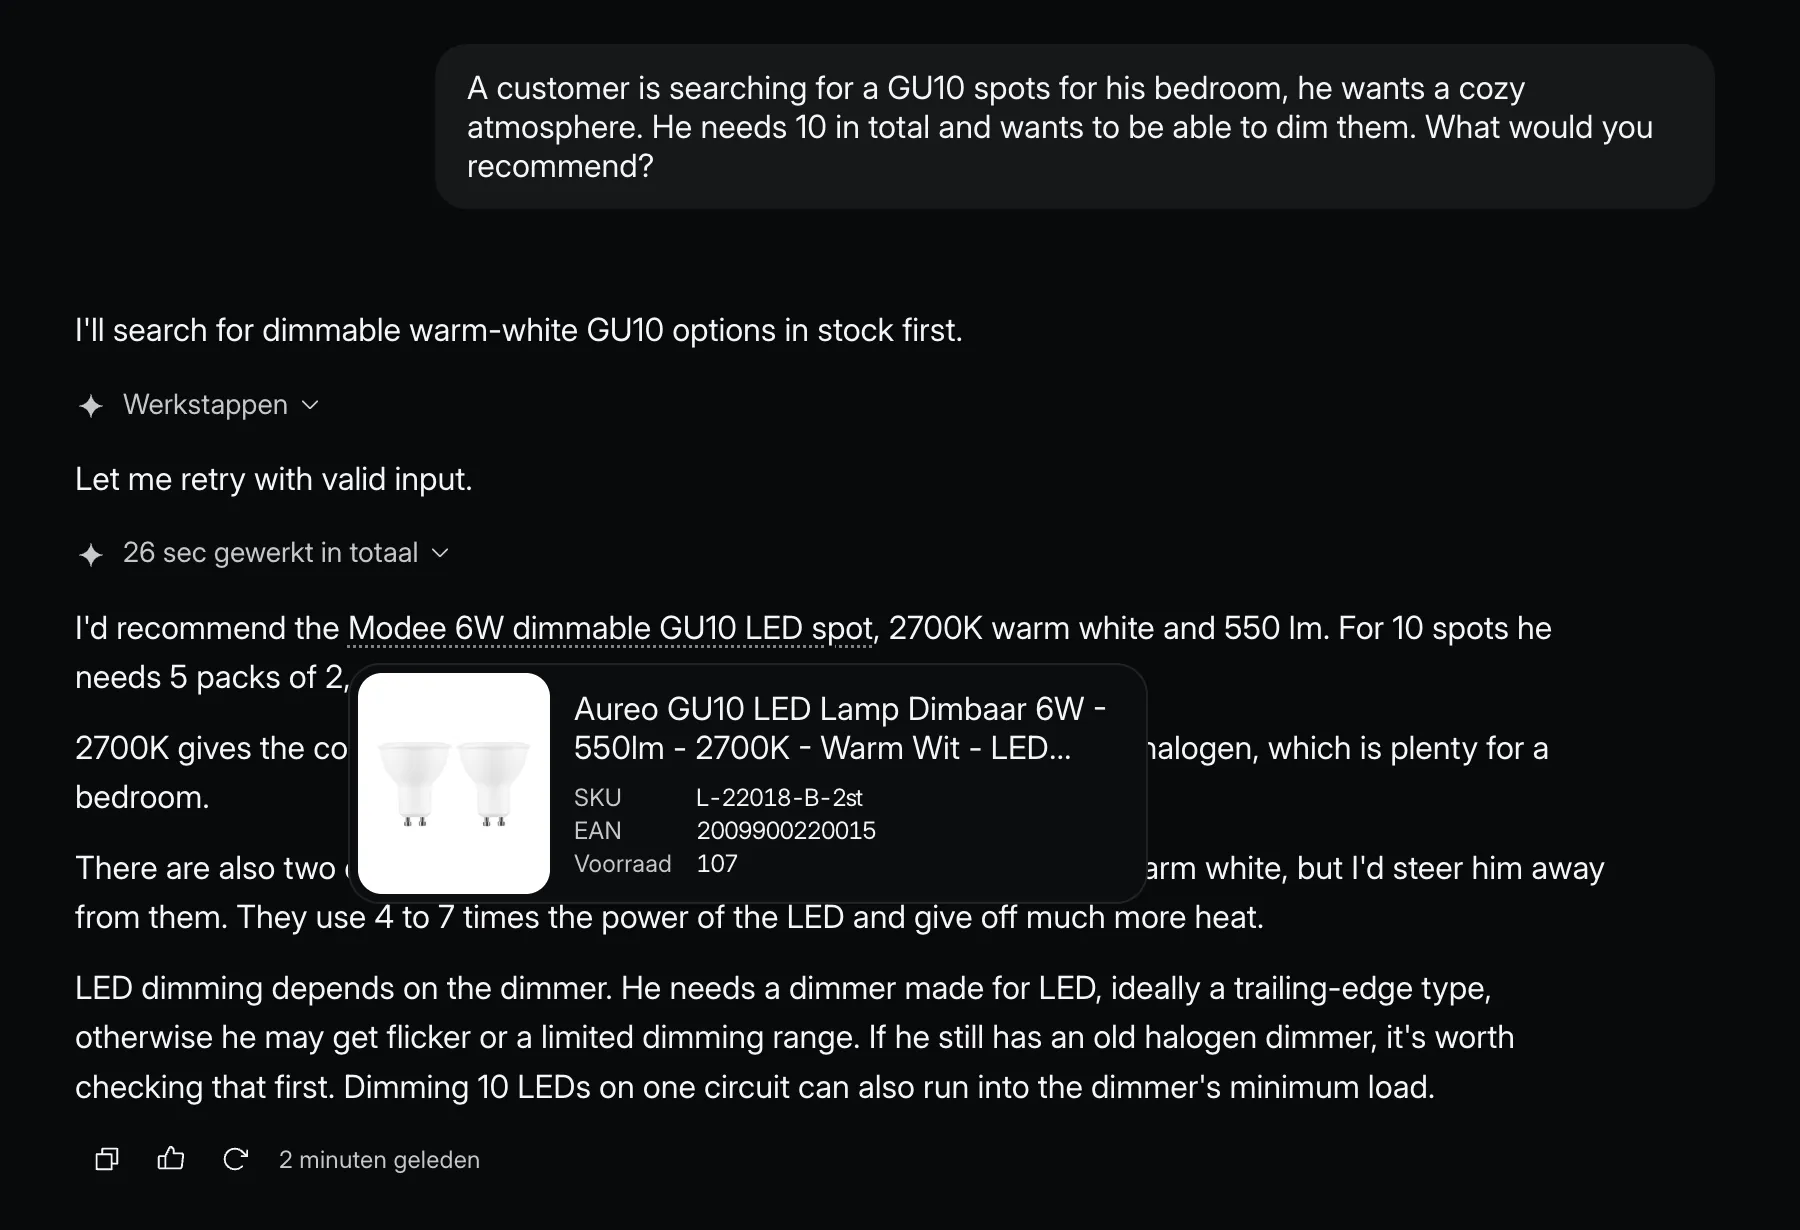
Sales and support ask it product questions. It checks what is in stock, links the product it recommends and explains why. It can read business data but never change it, and it has to pass evals before I switch models.
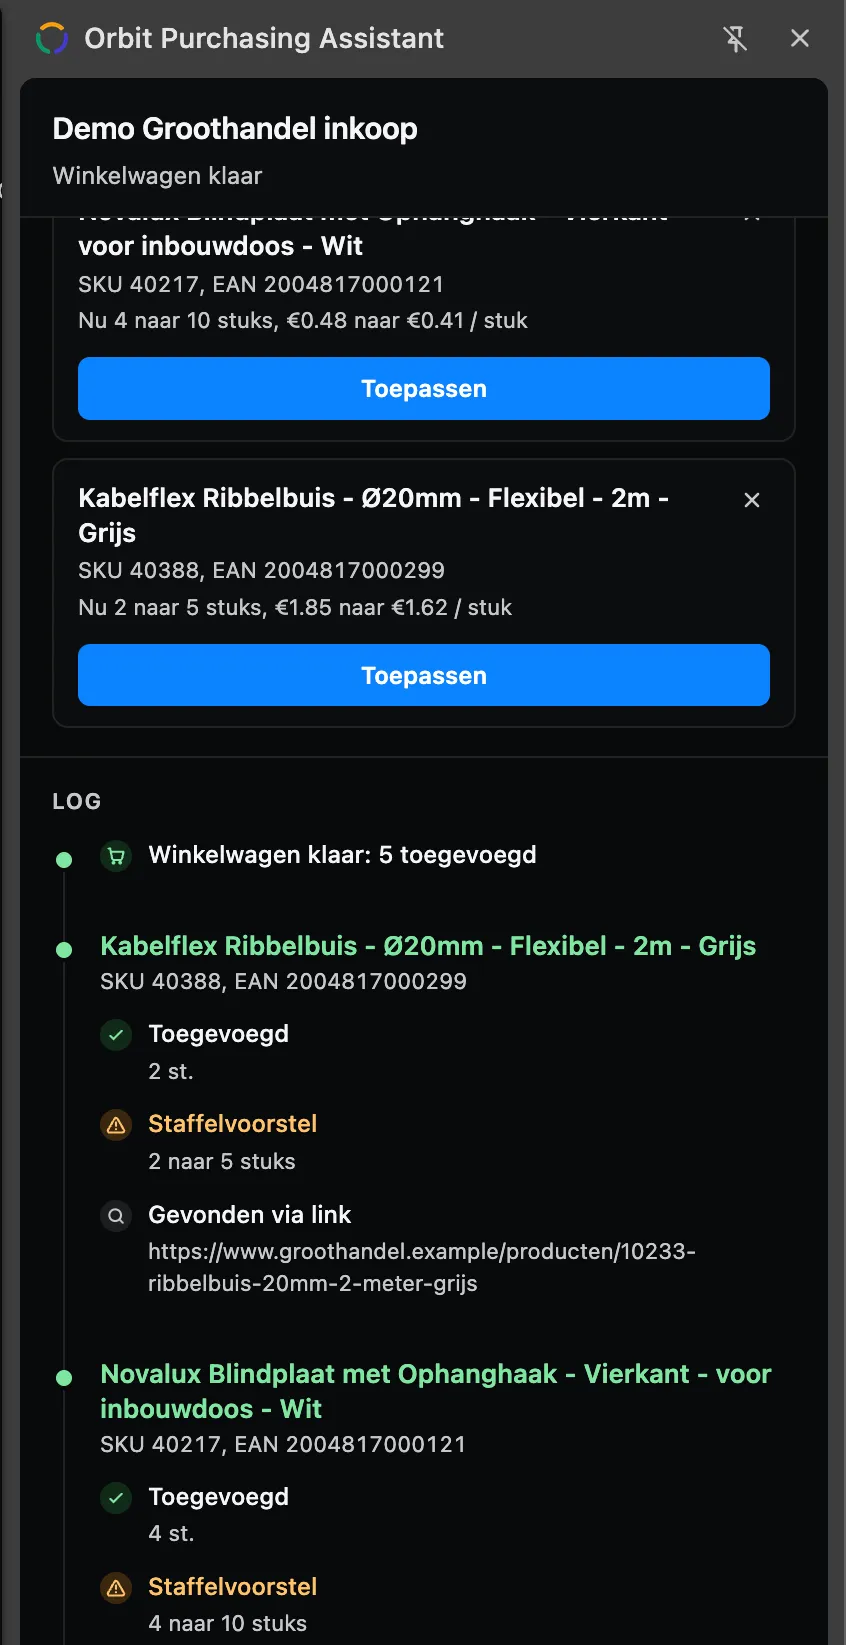
It fills the supplier's cart for a confirmed order and logs every step. When a bigger pack gets a better price, it suggests the larger quantity and lets the buyer decide.
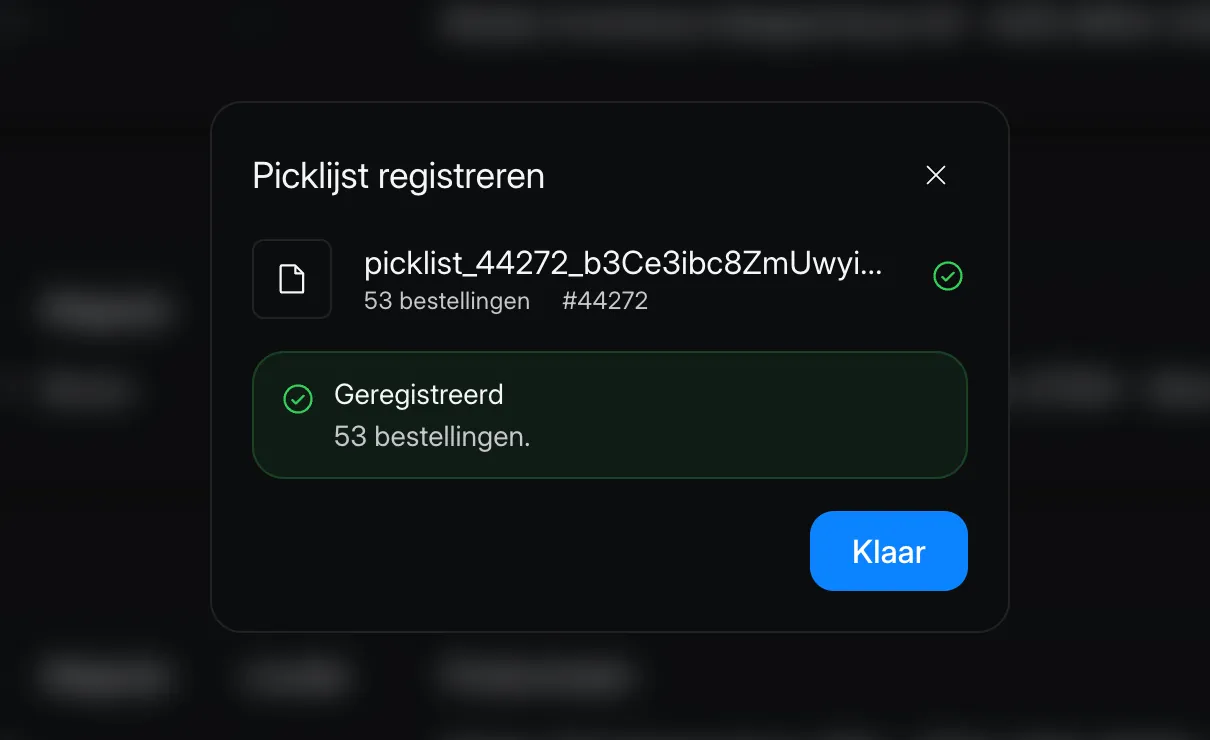
Barcode scanning, picklists and goods receipt checks. Upload a picklist and every order on it is registered in one step.
Bol, eBay, Kaufland, WooCommerce, Stockitup, QLS and Slack stay in sync on their own, so nobody has to upload a CSV again.
My role
01
I designed every screen. Dense where the work is dense, calm everywhere else. This is where my background in visual design shows most.
02
I designed the PostgreSQL schema. After the first version I rebuilt the platform on a better model, because the first one could not grow.
03
Forecasts, reorder rules and guardrails are mine. I decide what the system should do, and I check that it does.
04
AI coding agents write most of the code. I set the structure and the rules, review every change and know how each part works. If it breaks, it is mine to fix.
05
Changes go through migrations that I test locally first, never straight into production. AI model changes run against evals before they ship.
July 2025
First version, a JavaScript dashboard fed by CSV uploads.
October 2025
Rebuilt in Next.js on a new data model.
April 2026
My role changes from Visual Designer to Automation Engineer.
Today
In production, used every day by purchasing, sales, support and the warehouse.
Results
What's next
01
Forecasts that account for seasons and promotions, not just recent sales.
02
Supplier lead times learned from actual delivery dates, so the advice orders earlier when a supplier runs late.
03
The assistant drafts purchase orders, and a buyer reviews and approves them.